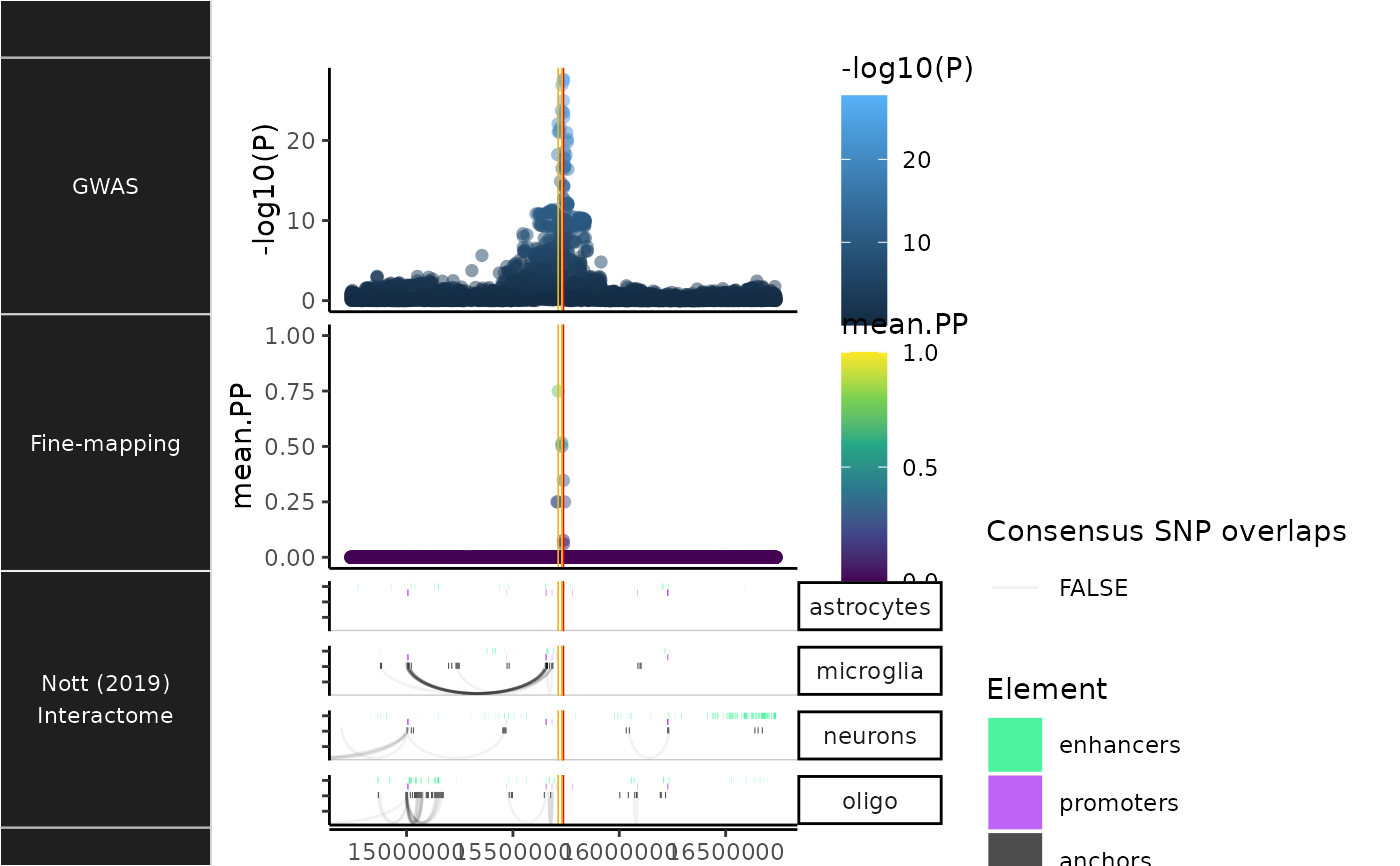
Plot brain cell-specific interactome data
Source:R/NOTT2019_plac_seq_plot.R
NOTT2019_plac_seq_plot.RdPlot brain cell-specific interactome data from Nott et al. (2019).
NOTT2019_plac_seq_plot(
  dat = NULL,
  locus_dir = NULL,
  title = NULL,
  show_plot = TRUE,
  save_plot = TRUE,
  return_interaction_track = FALSE,
  x_limits = NULL,
  zoom_window = NULL,
  index_SNP = NULL,
  genomic_units = "POS",
  color_dict = c(enhancers = "springgreen2", promoters = "purple", anchors = "black"),
  highlight_plac = TRUE,
  show_regulatory_rects = TRUE,
  show_anchors = TRUE,
  strip.text.y.angle = 0,
  xtext = TRUE,
  save_annot = FALSE,
  point_size = 2,
  height = 7,
  width = 7,
  dpi = 300,
  return_as = "Tracks",
  nThread = 1,
  verbose = TRUE
)
Source
Arguments
- dat
Fine-mapping results data from finemap_loci.
- locus_dir
Locus-specific directory.
- title
all title elements: plot, axes, legends (
element_text(); inherits fromtext)- show_plot
Print plot.
- save_plot
Whether to save the plot.
- return_interaction_track
Return only the interaction track (before completing the plot and showing it).
- x_limits
x-axis limits to be applied to all plots (useful when trying to keep a common coordinate system).
- zoom_window
Zoom window.
- index_SNP
Index/lead SNP RSID.
- genomic_units
Which genomic units to return window limits in.
- color_dict
Named list of colors for each regulatory element.
- highlight_plac
Whether to scale opacity of PLAC-seq interactions (arches) such that interactions with anchors containing Consensus SNPs will be colored darker (Default:
TRUE). IfFALSE, will instead apply the same opacity level to all interactions.- show_regulatory_rects
Show enhancers/promoters as rectangles.
- show_anchors
Show PLAC-seq anchors.
- strip.text.y.angle
Angle of the y-axis facet labels.
- xtext
Whether to include x-axis title and text.
- save_annot
Save the queried subset of bigwig annotations.
- point_size
Point size of each SNP in the GWAS/fine-mapping plots.
- height
height (defaults to the height of current plotting window)
- width
width (defaults to the width of current plotting window)
- dpi
dpi to use for raster graphics
- return_as
Plot class to convert
plot_listto:- nThread
Number of threads to parallelise downloads across.
- verbose
Print messages.
See also
Other NOTT2019:
NOTT2019_bigwig_metadata,
NOTT2019_epigenomic_histograms(),
NOTT2019_get_epigenomic_peaks(),
NOTT2019_get_interactions(),
NOTT2019_get_interactome(),
NOTT2019_get_promoter_celltypes(),
NOTT2019_get_promoter_interactome_data(),
NOTT2019_get_regulatory_regions(),
NOTT2019_superenhancers(),
get_NOTT2019_interactome(),
get_NOTT2019_superenhancer_interactome()
Examples
trks_plus_lines <- echoannot::NOTT2019_plac_seq_plot(dat = echodata::BST1)
#> NOTT2019:: Creating PLAC-seq interactome plot
#> ++ NOTT2019:: Getting promoter cell-type-specific data.
#> ++ NOTT2019:: Getting interactome data.
#> ++ NOTT2019:: Getting regulatory regions data.
#> Importing Astrocyte enhancers ...
#> Importing Astrocyte promoters ...
#> Importing Neuronal enhancers ...
#> Importing Neuronal promoters ...
#> Importing Oligo enhancers ...
#> Importing Oligo promoters ...
#> Importing Microglia enhancers ...
#> Importing Microglia promoters ...
#> Converting dat to GRanges object.
#> ++ NOTT2019:: Getting interaction anchors data.
#> Importing Microglia interactome ...
#> Importing Neuronal interactome ...
#> Importing Oligo interactome ...
#> Converting dat to GRanges object.
#> 29 query SNP(s) detected with reference overlap.
#> Converting dat to GRanges object.
#> 49 query SNP(s) detected with reference overlap.
#> Converting dat to GRanges object.
#> Preparing data for highlighting PLAC-seq interactions that overlap with SNP subset: Support>0
#> Initializing PLAC-seq plot.
#> ++ Adding enhancer/promoter rectangles
#> Creating GWAS track.
#> Creating fine-map track.
#> x_limits will be used to limit the min/max x-axis values for all plots.
#> Converting plots to a merged ggbio Tracks object.
#> Adding vertical track lines for LeadSNP and Consensus_SNP
