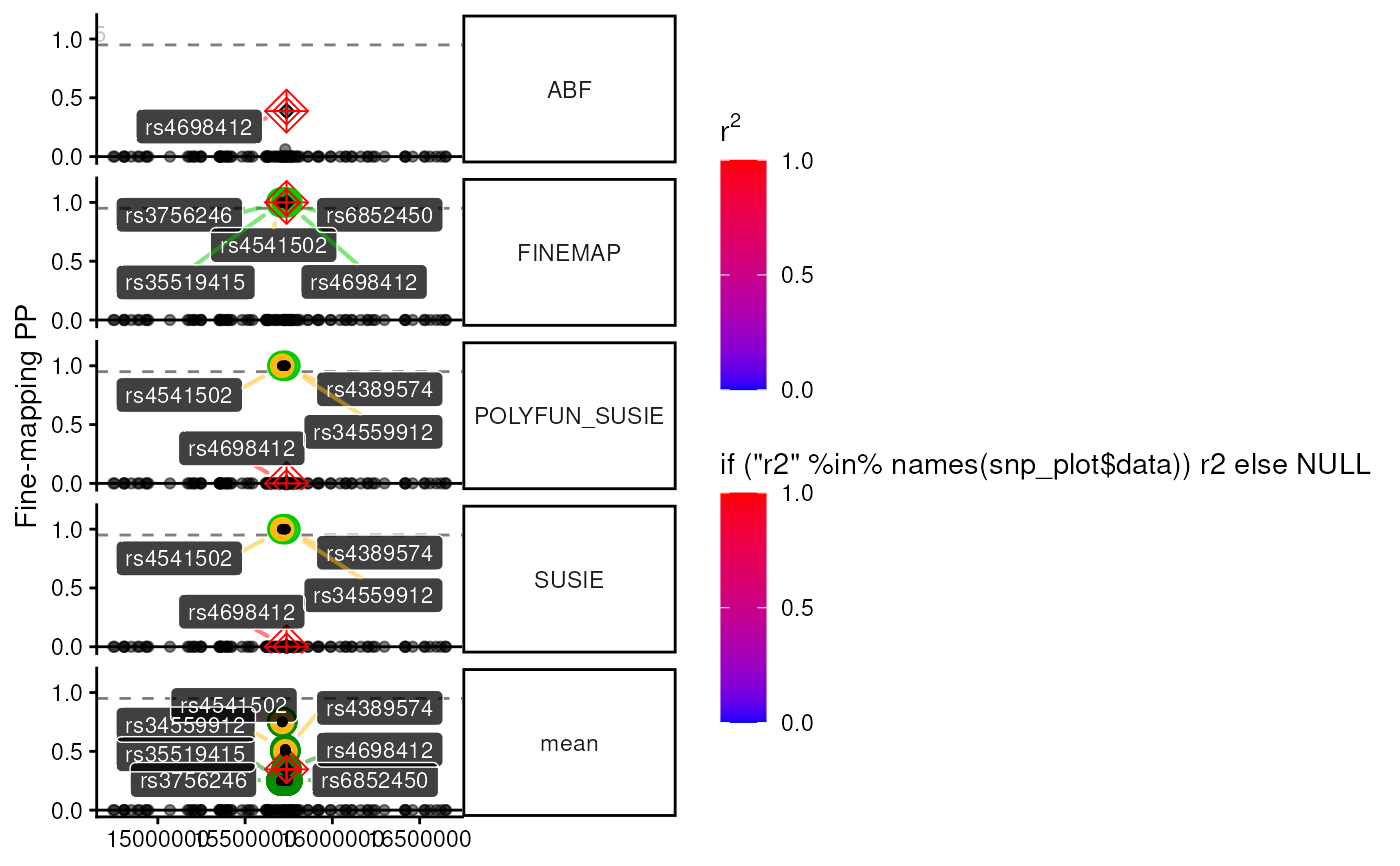
Manhattan plot of GWAS/QTL data with various fine-mapping related annotations. Support function for plot_locus.
Usage
snp_track_merged(
  dat,
  yvar = "-log10(P)",
  labels_subset = c("Lead", "CS", "UCS", "Consensus"),
  absolute_labels = FALSE,
  label_type = "rsid_only",
  label_leadsnp = TRUE,
  sig_cutoff = 5e-08,
  point_alpha = 0.5,
  show.legend = TRUE,
  xtext = TRUE,
  facet_formula = "Method~.",
  dataset_type = NULL,
  genomic_units = "POS",
  remove_duplicates = FALSE,
  strip.text.y.angle = 0,
  show_plot = FALSE,
  verbose = TRUE
)
Arguments
- dat
Data to query transcripts with.
- labels_subset
Include colored shapes and RSID labels to help highlight SNPs belonging to one or more of the following groups: Lead, Credible Set, Consensus.
- sig_cutoff
Filters out SNPs to plot based on an (uncorrected) p-value significance cutoff.
- point_alpha
Opacity of each data point.
- xtext
Include x-axis title and text for each track (not just the lower-most one).
- facet_formula
Formula to facet plots by. See facet_grid for details.
- dataset_type
Dataset type (e.g. "GWAS" or "eQTL").
- genomic_units
Which genomic units to return window limits in.
- remove_duplicates
Remove duplicate labels when SNPs are part of >1 group in
labels_subset.- strip.text.y.angle
Angle of the y-axis facet labels.
- show_plot
Print plot to screen.
- verbose
Print messages.